
Contents
Fse-strength-reduction-at-elevated-temperatures-v3.svg (SVG file, nominally 900 × 600 pixels, file size: 8 KB)
Summary
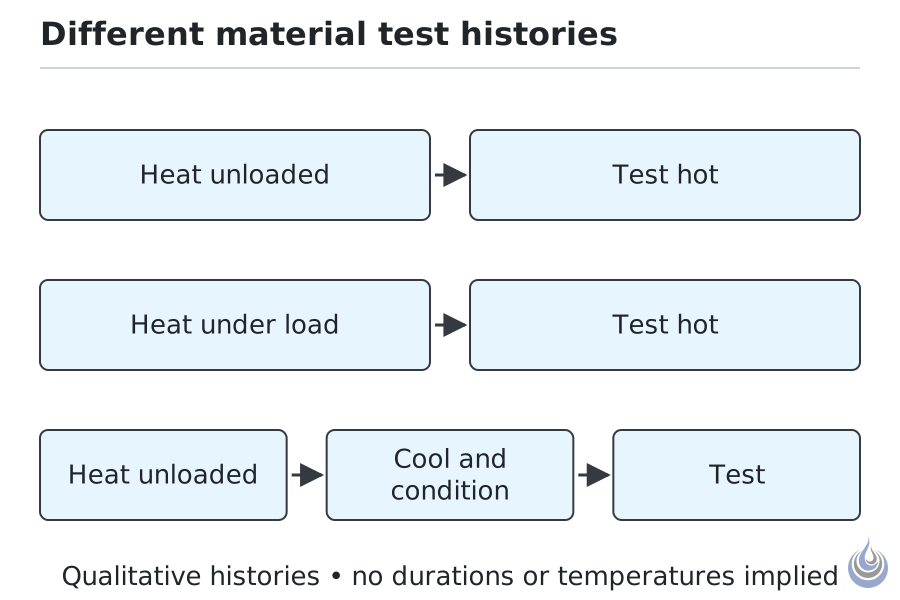
Concrete strength curves depend on the testing sequence. Based on Kodur and Harmathy (2002), p. 1-169.
Original illustration for Strength reduction at elevated temperatures, level 3 Advanced.
- Source basis: Kodur and Harmathy (2002), p. 1-169.
- Alt text: Three timelines distinguish loaded and unloaded hot tests from a test conducted after cooling.
- Accuracy notes: Qualitative process diagram only; no temperatures or durations inferred.
Licensing
New drawing by Fire Safety Academy. © Fire Safety Academy.
File history
Click on a date/time to view the file as it appeared at that time.
| Date/Time | Thumbnail | Dimensions | User | Comment | |
|---|---|---|---|---|---|
| current | 16:42, 2 November 2026 | | 900 × 600 (8 KB) | Emma (talk | contribs) | Watermark: Fire Safety Academy logo icon, 70 px, 45 % opacity |
You cannot overwrite this file.
File usage
The following page uses this file:
