
Contents
Fse-societal-risk-v2.svg (SVG file, nominally 900 × 600 pixels, file size: 9 KB)
Summary
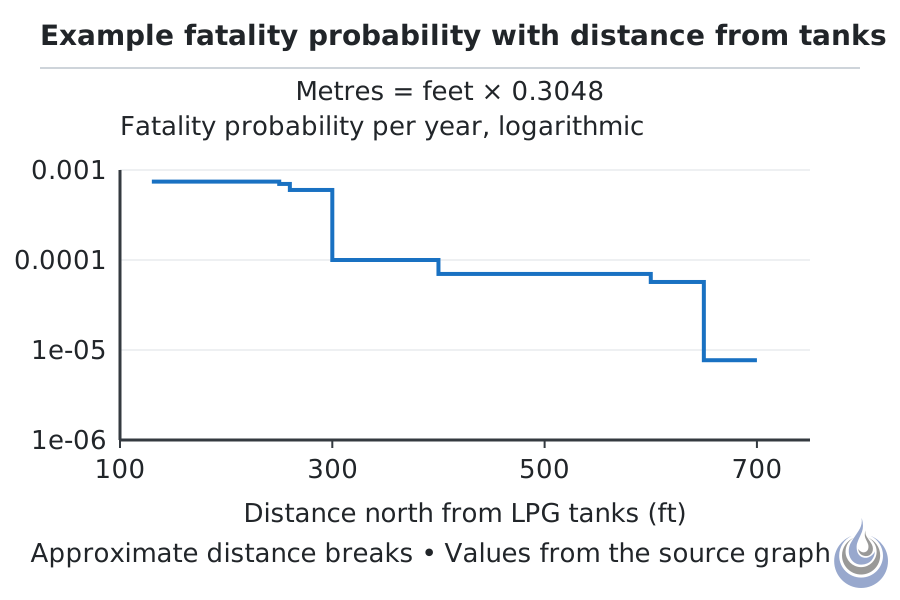
Individual risk profile: fatality probability per year against distance north from the LPG tanks of an example plant. Based on Barry (2002), p. 5-210.
Original illustration for Societal risk, level 4 Expert.
- Source basis: Barry (2002), p. 5-210 (Figure 5-13.33, example of individual risk profile graph); redraw, do not copy
- Alt text: Step chart of fatality probability per year falling from about 7.4 times ten to minus four near LPG tanks to 7.7 times ten to minus six at about 700 ft.
Licensing
New drawing by Fire Safety Academy. © Fire Safety Academy.
File history
Click on a date/time to view the file as it appeared at that time.
| Date/Time | Thumbnail | Dimensions | User | Comment | |
|---|---|---|---|---|---|
| current | 17:43, 2 November 2026 | | 900 × 600 (9 KB) | Jan (talk | contribs) | Watermark: Fire Safety Academy logo icon, 70 px, 45 % opacity |
You cannot overwrite this file.
File usage
The following page uses this file:
