
Contents
Fse-high-risk-populations-v3.svg (SVG file, nominally 900 × 813 pixels, file size: 7 KB)
Summary
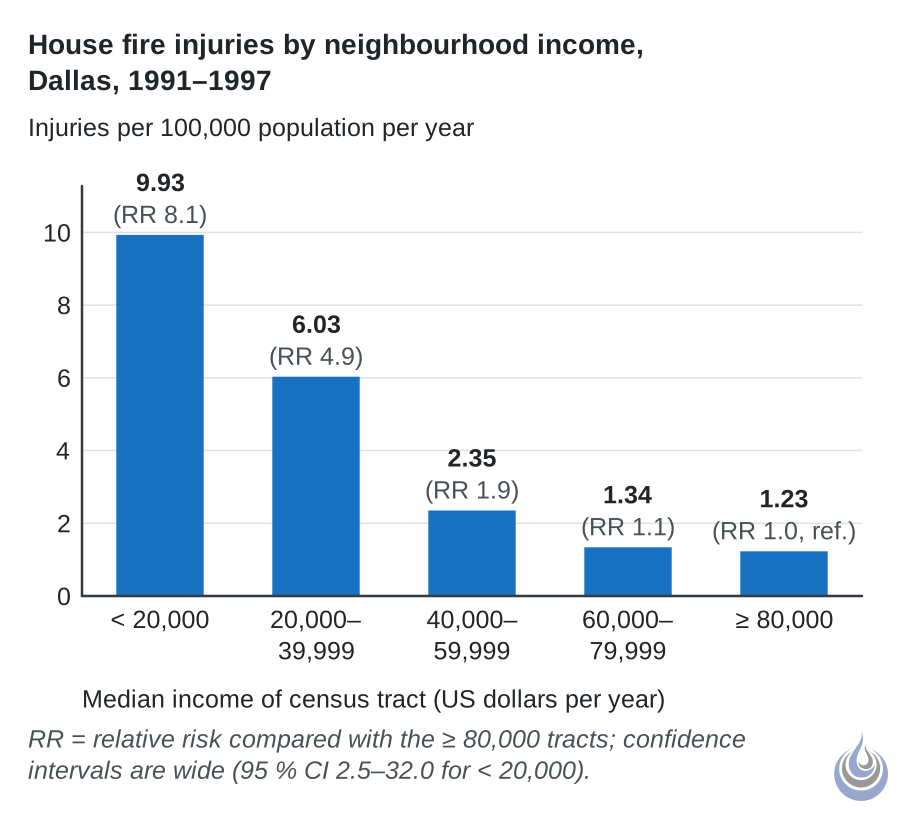
House fire injuries per 100,000 population per year by median income of the census tract, Dallas, 1991 to 1997.
Original illustration for High-risk populations.
- Alt text: Bar chart of house fire injuries per 100,000 population per year in Dallas falling from 9.93 in the poorest tracts to 1.23 in the richest
Licensing
New drawing by Fire Safety Academy. © Fire Safety Academy.
File history
Click on a date/time to view the file as it appeared at that time.
| Date/Time | Thumbnail | Dimensions | User | Comment | |
|---|---|---|---|---|---|
| current | 18:13, 14 November 2026 | | 900 × 813 (7 KB) | Linda (talk | contribs) | Watermark: Fire Safety Academy logo icon, 70 px, 45 % opacity |
You cannot overwrite this file.
File usage
The following page uses this file:
