
Contents
Fse-fire-toxicity-v4.svg (SVG file, nominally 900 × 600 pixels, file size: 8 KB)
Summary
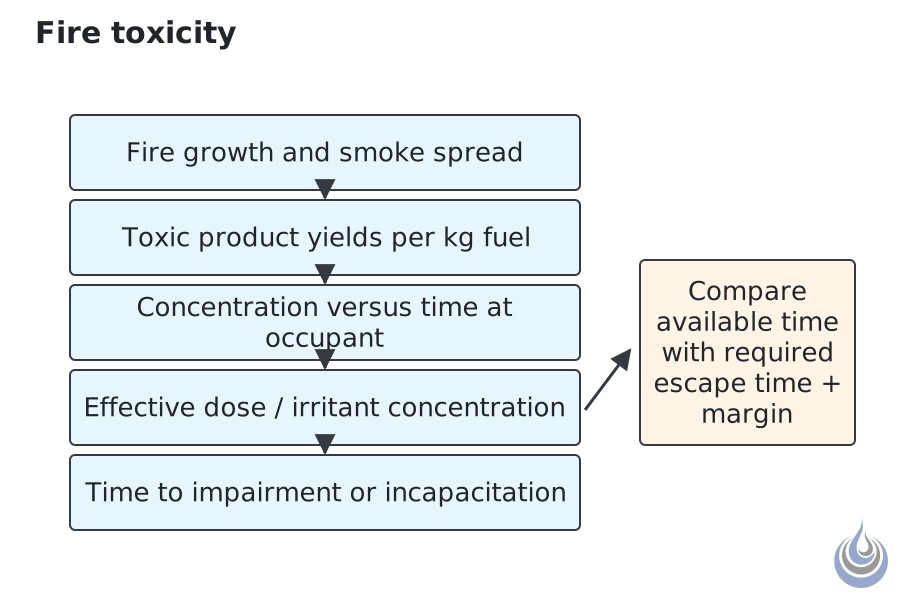
Steps of a toxic hazard assessment: from fire growth and product yields to the time to incapacitation, compared with the time needed to escape. Based on Purser (2002), pp. 2-85 and 2-95.
Original vector illustration for Fire toxicity, level 2 Intermediate.
- Source basis: Purser (2002), p. 2-85 (two parallel processes: developing hazard and escape; margin of safety), p. 2-95 (steps of a toxic hazard assessment of full-scale fires: mass loss, time–concentration curves, FIC and FED calculations).
- Alt text: Flowchart from fire growth and toxic yields to gas concentrations over time, then FED and FIC, then time to incapacitation compared with escape time.
Licensing
New drawing by Fire Safety Academy. © Fire Safety Academy.
File history
Click on a date/time to view the file as it appeared at that time.
| Date/Time | Thumbnail | Dimensions | User | Comment | |
|---|---|---|---|---|---|
| current | 17:11, 2 November 2026 | | 900 × 600 (8 KB) | Lisa (talk | contribs) | Watermark: Fire Safety Academy logo icon, 70 px, 45 % opacity |
You cannot overwrite this file.
File usage
The following page uses this file:
