


Contents
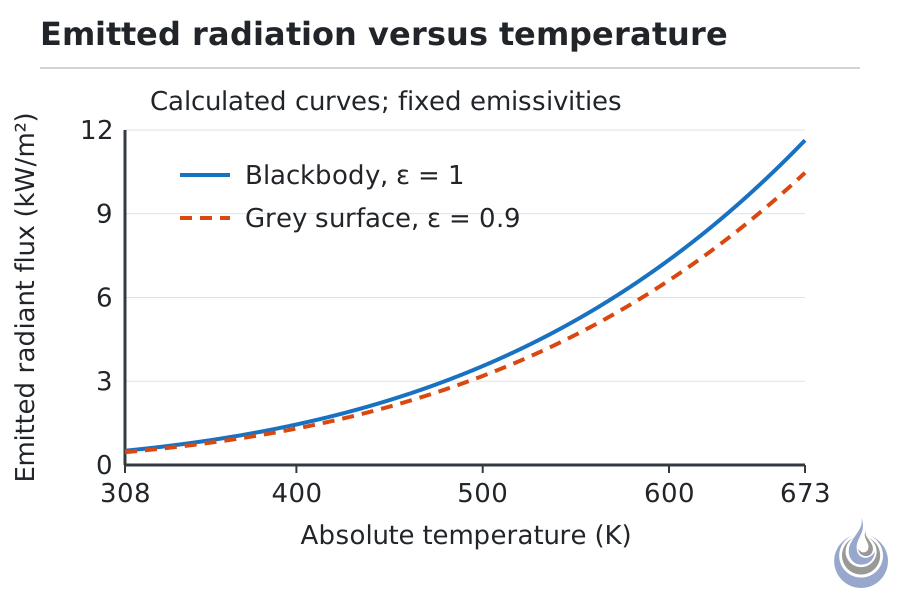
Fse-stefan-boltzmann-law-v1.svg (SVG file, nominally 900 × 600 pixels, file size: 12 KB)
Summary
Calculated source emission increases with the fourth power of absolute temperature. Based on Van Rossum (2027), §5.4.
Original illustration for Stefan-Boltzmann law, level 3 Advanced.
- Source basis: Van Rossum (2027), §5.4; Tien et al. (2002), p. 1-74. New calculated plot, not measured material data.
- Alt text: Two calculated curves rise steeply with temperature; the emissivity 0.9 curve stays below the blackbody curve.
- Accuracy notes: Use kelvin in the formula, not Celsius. Divide W/m² by1000 for the plotted kW/m². Do not describe emitted flux as target flux.
Licensing
New drawing by Fire Safety Academy. © Fire Safety Academy.
File history
Click on a date/time to view the file as it appeared at that time.
| Date/Time | Thumbnail | Dimensions | User | Comment | |
|---|---|---|---|---|---|
| current | 16:11, 2 November 2026 | | 900 × 600 (12 KB) | Emma (talk | contribs) | Watermark: Fire Safety Academy logo icon, 70 px, 45 % opacity |
| 07:25, 2 November 2026 | 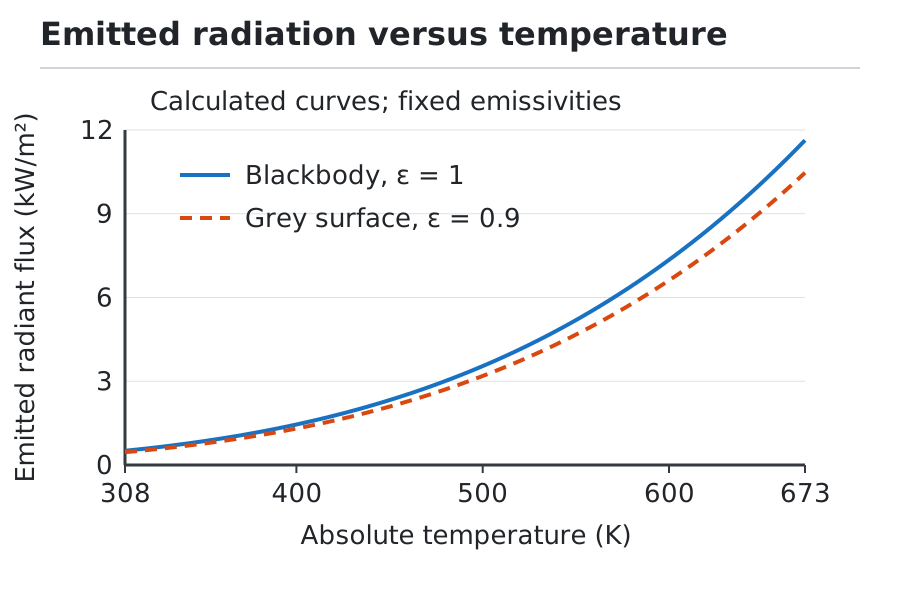 | 900 × 600 (9 KB) | Emma (talk | contribs) | Level 3 visual plan: fse-stefan-boltzmann-law-v1.svg |
You cannot overwrite this file.
File usage
The following page uses this file:
