


Contents
Fse-data-centre-fire-protection-v3.svg (SVG file, nominally 864 × 900 pixels, file size: 7 KB)
Summary
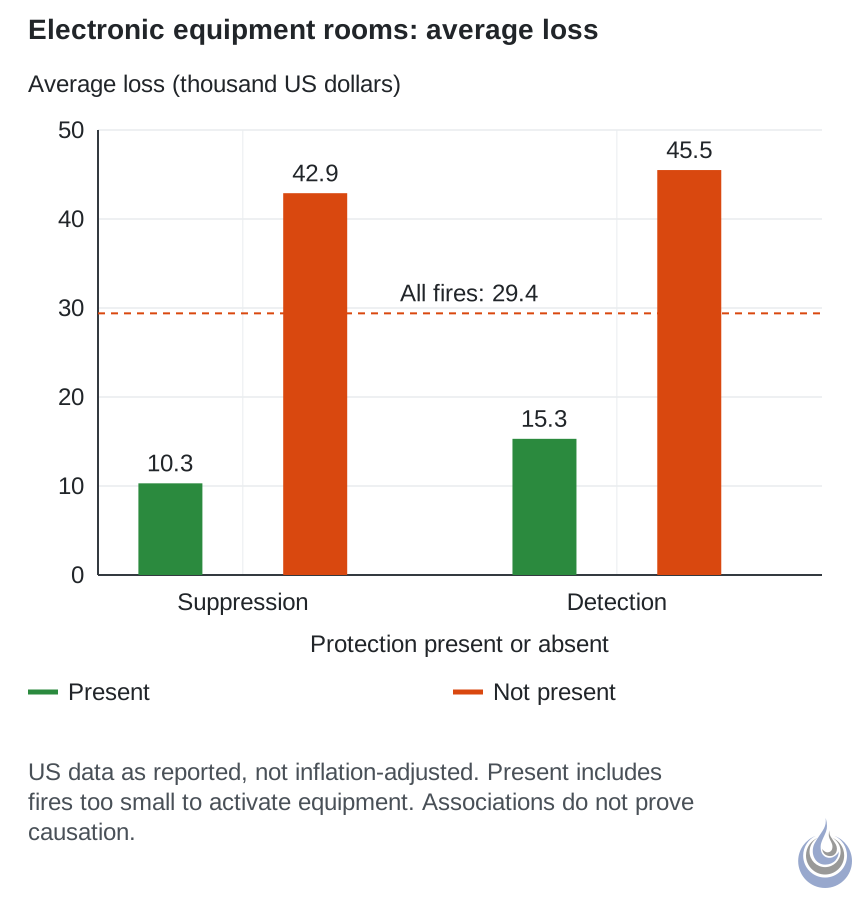
Average direct loss per fire in US non-home electronic equipment room fires, 1994–1998 annual averages, with and without automatic suppression and smoke detection. Based on Rawson (2008), pp. 8-62–8-63.
Original illustration for Data centre fire protection.
- Alt text: Bar chart of average loss per fire with and without automatic suppression and with and without detection in US electronic equipment room fires 1994 to 1998
Licensing
New drawing by Fire Safety Academy. © Fire Safety Academy.
File history
Click on a date/time to view the file as it appeared at that time.
| Date/Time | Thumbnail | Dimensions | User | Comment | |
|---|---|---|---|---|---|
| current | 13:13, 12 November 2026 | | 864 × 900 (7 KB) | Peter (talk | contribs) | Watermark: Fire Safety Academy logo icon, 70 px, 45 % opacity |
You cannot overwrite this file.
File usage
The following page uses this file:
