
Contents
Fse-uncertainty-analysis-v4.svg (SVG file, nominally 900 × 600 pixels, file size: 10 KB)
Summary
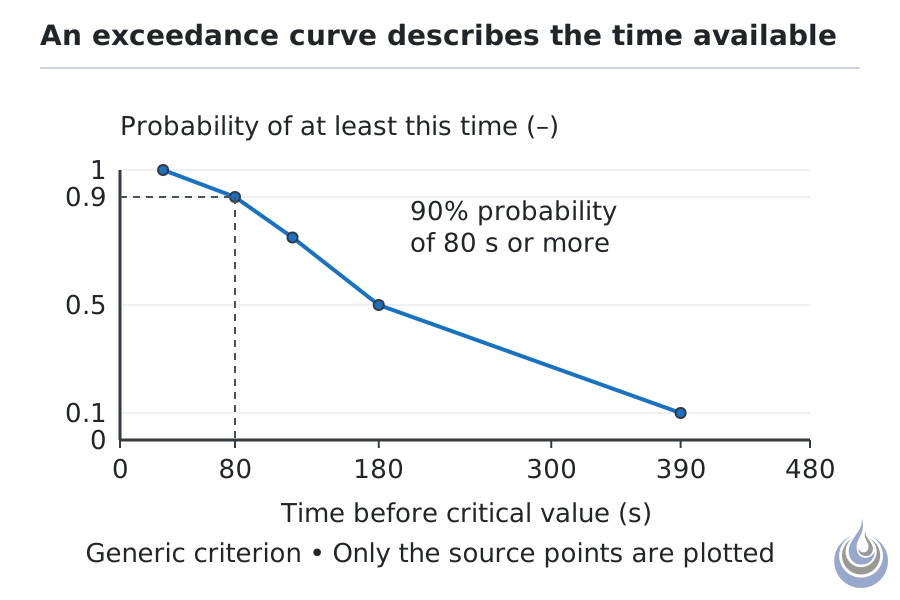
Probability of having at least a given time before a critical value is reached, from many design fire scenarios; a requirement of 0.9 is met for times up to about 80 s. Based on Notarianni (2002), pp. 5-56 and 5-59.
Original illustration for Uncertainty analysis, level 4 Expert.
- Source basis: Notarianni (2002), p. 5-56 (construction of the curve from n scenario results and the values above; Figure 5-4.3 on p. 5-57: redraw, do not copy) and p. 5-59 (0.9 probability of 80 s or more); pp. 5-53–5-54 (probabilistic statement of performance)
- Alt text: Falling curve of the probability of having at least a given time before a critical value, with a marked point at 0.9 and 80 s.
Licensing
New drawing by Fire Safety Academy. © Fire Safety Academy.
File history
Click on a date/time to view the file as it appeared at that time.
| Date/Time | Thumbnail | Dimensions | User | Comment | |
|---|---|---|---|---|---|
| current | 17:45, 2 November 2026 | | 900 × 600 (10 KB) | Jan (talk | contribs) | Watermark: Fire Safety Academy logo icon, 70 px, 45 % opacity |
You cannot overwrite this file.
File usage
The following page uses this file:
