
Contents
Fse-fire-water-supply-v4.svg (SVG file, nominally 900 × 600 pixels, file size: 9 KB)
Summary
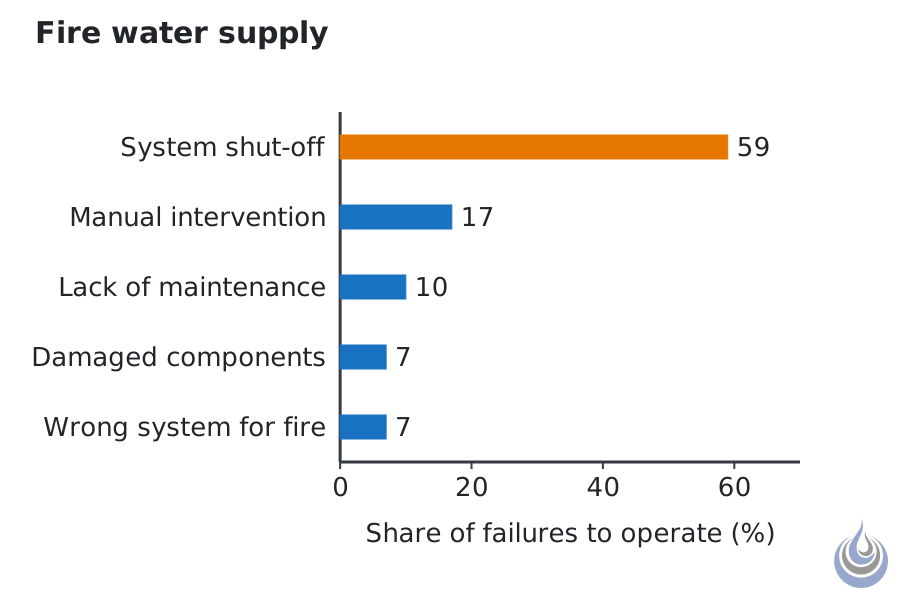
Causes of sprinkler systems failing to operate in US fires, as summarised in the Australian data sheets. Based on Ahrens (2017), as cited in Australian Building Codes Board (2020a), Data Sheet C2, p. 79.
Original vector illustration for Fire water supply, level 2 Intermediate.
- Source basis: Australian Building Codes Board (2020a), Data Sheet C2, p. 79 (Table 6, based on Ahrens 2017)
- Alt text: Bar chart of why sprinklers failed to operate: shut off 59 %, manual intervention 17 %, maintenance 10 %, damage 7 %, wrong system 7 %.
Licensing
New drawing by Fire Safety Academy. © Fire Safety Academy.
File history
Click on a date/time to view the file as it appeared at that time.
| Date/Time | Thumbnail | Dimensions | User | Comment | |
|---|---|---|---|---|---|
| current | 17:25, 2 November 2026 | | 900 × 600 (9 KB) | Lisa (talk | contribs) | Watermark: Fire Safety Academy logo icon, 70 px, 45 % opacity |
You cannot overwrite this file.
File usage
The following page uses this file:
