
Contents
Fse-reliability-of-fire-protection-systems-v3.svg (SVG file, nominally 900 × 600 pixels, file size: 9 KB)
Summary
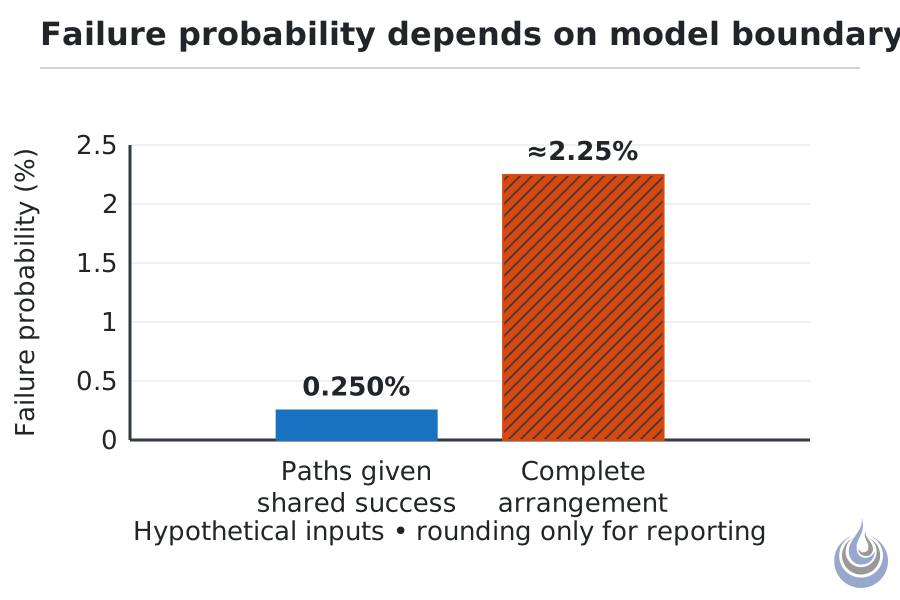
The model boundary changes the calculated failure probability when a necessary shared supply is included. Based on Modarres and Joglar-Billoch (2002), p. 5-32, and Hall (2002), p. 1-184; numerical inputs are hypothetical.
Original illustration for Reliability of fire protection systems, level 3 Advanced.
- Source basis: Modarres and Joglar-Billoch (2002), p. 5-32; Hall (2002), p. 1-184; calculations/reliability-of-fire-protection-systems.py and its JSON results.
- Alt text: Two bars compare failure probabilities of 0.250% for the alternative paths and approximately 2.25% for the complete arrangement.
- Accuracy notes: Zero-baseline bars. The two bars describe different model boundaries, not measured systems or current acceptance targets. Use unrounded coordinates and round only labels to three significant figures.
Licensing
New drawing by Fire Safety Academy. © Fire Safety Academy.
File history
Click on a date/time to view the file as it appeared at that time.
| Date/Time | Thumbnail | Dimensions | User | Comment | |
|---|---|---|---|---|---|
| current | 17:14, 2 November 2026 | | 900 × 600 (9 KB) | Emma (talk | contribs) | Watermark: Fire Safety Academy logo icon, 70 px, 45 % opacity |
You cannot overwrite this file.
File usage
The following page uses this file:
