


Contents
Fse-waste-chute-v3.svg (SVG file, nominally 1,000 × 1,030 pixels, file size: 7 KB)
Summary
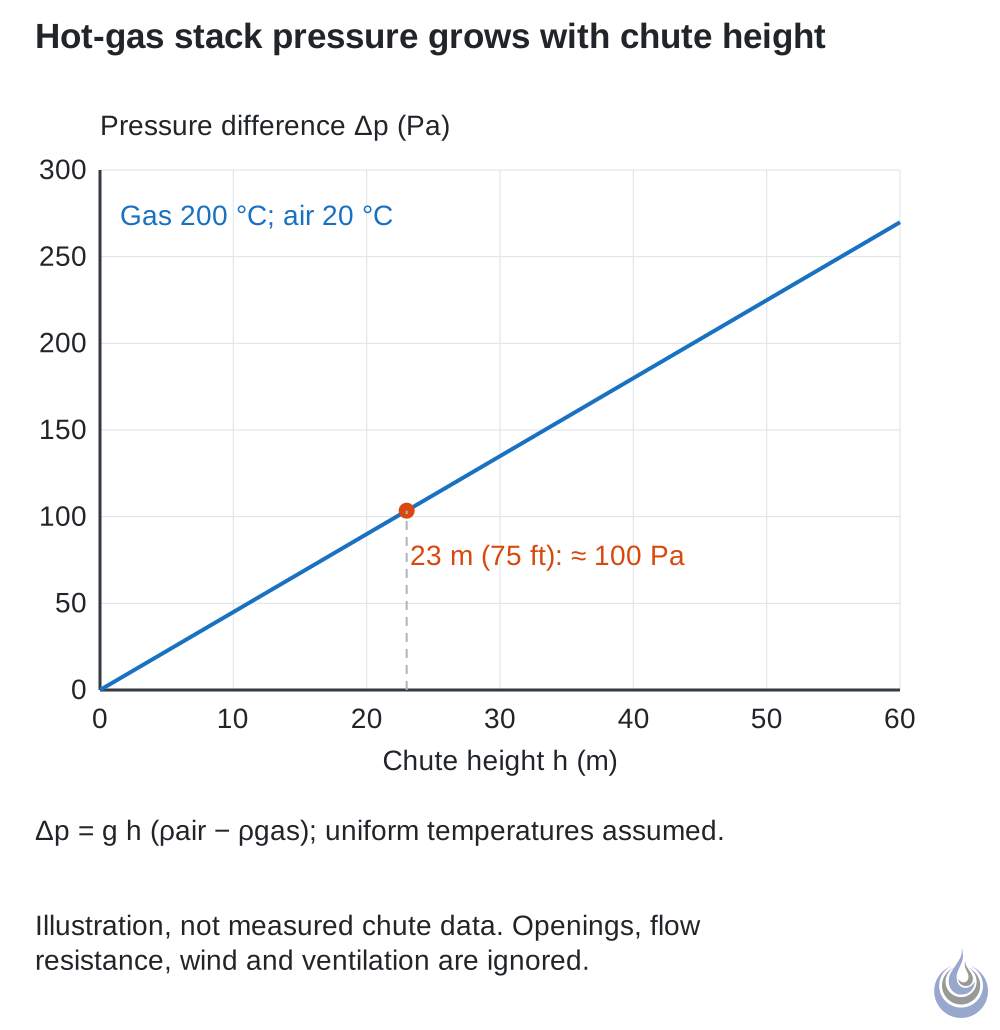
Pressure difference between a column of gas at 200 °C and air at 20 °C as a function of chute height, Δp ≈ g·h·(ρ₁ − ρ₂), an illustration with the book's example temperatures.
Original illustration for Waste chute.
- Alt text: Line chart of stack pressure difference rising linearly with chute height, about 100 Pa at 23 m for 200 degree gas
Licensing
New drawing by Fire Safety Academy. © Fire Safety Academy.
File history
Click on a date/time to view the file as it appeared at that time.
| Date/Time | Thumbnail | Dimensions | User | Comment | |
|---|---|---|---|---|---|
| current | 13:11, 12 November 2026 | | 1,000 × 1,030 (7 KB) | Peter (talk | contribs) | Watermark: Fire Safety Academy logo icon, 70 px, 45 % opacity |
You cannot overwrite this file.
File usage
The following page uses this file:
