
Level 3 visual plan: fse-critical-heat-flux-for-ignition-v3.svg |
Emma uploaded a new version of File:Fse-critical-heat-flux-for-ignition-v3.svg |
||
(No difference)
| |||


Latest revision as of 16:12, 2 November 2026
Summary
Doubling the excess flux above the threshold quarters the calculated ignition time. Based on Iqbal and Salley (2004), pp. 6-5–6-6.
Original illustration for Critical heat flux for ignition, level 3 Advanced.
- Source basis: Iqbal and Salley (2004), pp. 6-5–6-6.
- Alt text: Red oak model ignition-time curve, showing about 141 seconds at 20 kW/m² and 35.2 seconds at 30 kW/m².
- Accuracy notes: Plot unrounded values; labels round available times down. The curve is not measured data or a universal oak property.
Licensing
New drawing by Fire Safety Academy. © Fire Safety Academy.
File history
Click on a date/time to view the file as it appeared at that time.
| Date/Time | Thumbnail | Dimensions | User | Comment | |
|---|---|---|---|---|---|
| current | 16:12, 2 November 2026 | 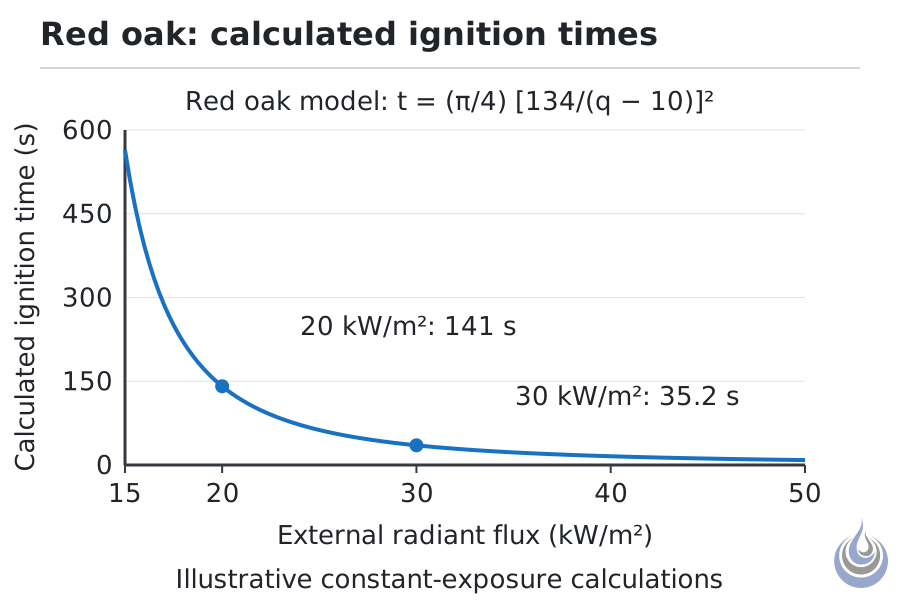 | 900 × 600 (12 KB) | Emma (talk | contribs) | Watermark: Fire Safety Academy logo icon, 70 px, 45 % opacity |
| 07:27, 2 November 2026 | 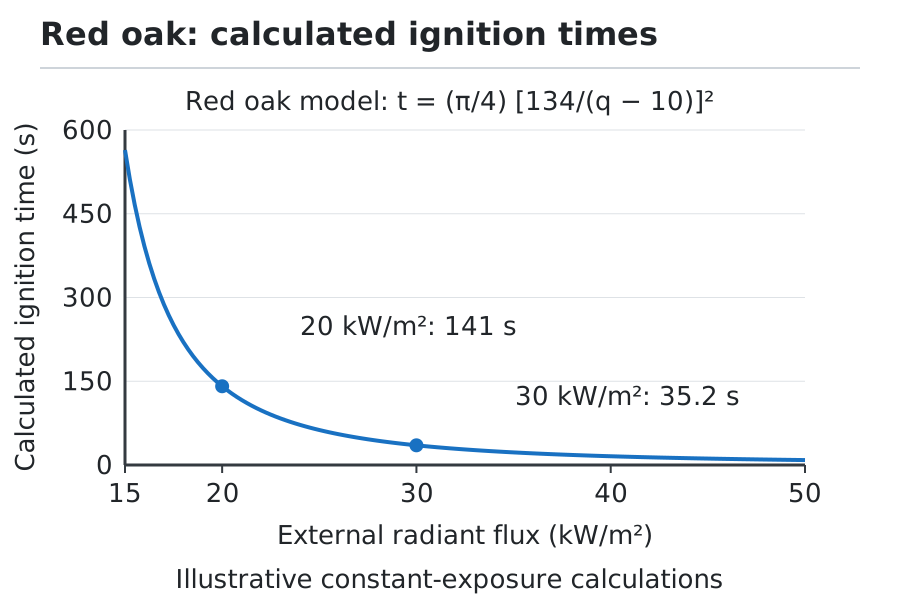 | 900 × 600 (9 KB) | Emma (talk | contribs) | Level 3 visual plan: fse-critical-heat-flux-for-ignition-v3.svg |
You cannot overwrite this file.
File usage
The following page uses this file:
